Excel Data Analysis
Excel ~ San Francisco Police Department Incidents Report 2018 - 2023
Data Dictionary
https://datasf.gitbook.io/datasf-dataset-explainers/sfpd-incident-report-2018-to-present
Dataset
Police Department Incident Reports: 2018 to Present
Objective
The “Police Department Incident Reports: 2018 to Present” data from the San Francisco Police Department provides a comprehensive record of incidents reported in the city over the past few years. This project aims to leverage data analytics techniques within Microsoft Excel to extract valuable insights and patterns from this extensive dataset. By applying analytical methods to this rich source of information, we aim to gain a deeper understanding of various aspects of law enforcement and public safety in San Francisco. The dataset records incidents from January 1, 2018 up to October 27, 2023.
Key Questions to Address
- What is the overall trend in the number of incidents reported from 2018 to the present?
- Which types of incidents are most frequently reported?
- Which neighborhoods exhibit the highest concentration of reported incidents?
- What time of day sees the highest incidence of reported incidents?
- Are there incidents involving the same individuals or locations occurring over time?
- Do specific events or holidays correlate with spikes in reported incidents?
Data Cleaning
During the data cleaning process, non-essential columns were removed to focus on those directly relevant to answering our key questions. Additionally, each column’s data type was carefully adjusted in Excel to facilitate more meaningful analysis.
Some records contained empty cells, which were normalized. For instance, rows with specific descriptions in the Incident Description column had corresponding blank values in both the Incident Category and Incident Subcategory columns. To address this, I opted to fill in these empty cells with the incident description.
In the ‘Filed Online’ column, any empty cells were filled with the Boolean value FALSE. Furthermore, a minor discrepancy was identified in the ‘Incident Category’ column, where ‘weapons offence’ and ‘weapons offense’ were used interchangeably. To standardize the data, I uniformly changed ‘Weapons Offence’ to ‘Weapons Offense’.
To enhance our analysis, new columns were engineered:
- Incident Hour: This column represents the hour as an integer value. For example, 13:30 is represented as 13.
- Incident Month: This column displays the month in string format (e.g., January).
- Holiday: Indicates whether an incident occurred on a U.S. holiday or not.
- Days Elapsed: This column calculates the difference in days between report datetime and incident datetime. It’s worth noting that one record (Row ID: 66263609320) exhibited a negative time lapse, suggesting a potential input error. Given this isolated occurrence, I removed it from the dataset.
According to the data dictionary, incident reports can have multiple associated incident codes. For example, an officer might record two incident codes for a single event, such as one for a warrant and another for the discovery of narcotics. While multiple incident codes coexist, the Incident ID, Incident Number, and CAD Numbers remain consistent. The Row ID field serves as a unique identifier for each data row.
| Incident Datetime | Row ID | Incident ID | Incident Number | CAD Number | Incident Code | Incident Category |
|---|---|---|---|---|---|---|
| 1/1/18 13:20 | 61902222223 | 60044 | 180999999 | 180222222 | 62050 | Warrant |
| 1/1/18 13:20 | 61903333320 | 60044 | 180999999 | 180222222 | 16710 | Drug Offense |
Nevertheless, the dataset presented inconsistent Incident IDs for the same Incident Number, as observed in the provided screenshots. For instance, Incident Number 000000000 was associated with different Incident ID numbers. Another example was Incident Number 190202001, which also displayed varying Incident ID numbers. Given this discrepancy, I decided to omit the Incident ID column from our working dataset.
Data Exploration
Descriptive statistics
- Incident Date and Report Datetime ranges from January 1, 2018, until October 27, 2023, covering a span of 5 years and 10 months. The dataset comprises a total of 788,117 records.
- The average Incident Hour is approximately 12.9 with a standard deviation of 6.4. This indicates a relatively wide distribution of incidents throughout the day. Further investigation into specific time periods may reveal interesting patterns.
- Examining the Days Elapsed variable reveals valuable insights. The minimum value of 0 implies that some incidents were reported on the same day they occurred, while the maximum value of 2,040 days suggests instances of delayed reporting. A comprehensive analysis of incidents with high days elapsed values may uncover underlying reasons for reporting delays. The mean of around 8 days is likely influenced by outliers, whereas the mode and median indicate that a significant portion of incidents are reported promptly on the same day.
- The metric for Repeated Incidents provides significant information. The average value of 1 suggests that most incidents do not involve repeated offenders. However, the presence of a maximum value of 226 indicates a single individual responsible for an extensive number of incidents. A thorough investigation into this outlier is warranted to understand the nature of these repeated incidents and potentially identify patterns or systemic issues.
Report Type Code:
| Report Type Code | Count | % |
|---|---|---|
| II | 619289 | 78.58% |
| IS | 81570 | 10.35% |
| VI | 52194 | 6.62% |
| VS | 35064 | 4.45% |
| Total | 788117 | 100.00% |
- Count: The majority of incidents fall under Report Type Code “II”, which constitutes approximately 78.58% of all reports.
- Distribution: The distribution of Report Type Codes suggests that a significant portion of incidents are categorized as “II” reports which are initial reports.
Report Type Description:
| Report Type Description | Count | % |
|---|---|---|
| Initial | 477739 | 60.62% |
| Initial Supplement | 64096 | 8.13% |
| Vehicle Initial | 52194 | 6.62% |
| Vehicle Supplement | 35064 | 4.45% |
| Coplogic Supplement | 17474 | 2.22% |
| Coplogic Initial | 141550 | 17.96% |
| Total | 788117 | 100.00% |
- Count: The most common report type description is “Initial” with a count of 477,739, representing 60.62% of all reports.
- Supplements: Initial and Initial Supplement together account for a substantial majority of incidents (about 68.75%).
Filed Online:
| Filed Online | Count | % |
|---|---|---|
| TRUE | 159024 | 20.18% |
| FALSE | 629093 | 79.82% |
| Total | 788117 | 100.00% |
- Usage: A noteworthy observation is that approximately 20.18% of incidents were filed online using Coplogic, indicating a significant adoption of the self-service reporting system.
- Non-Online Reports: The majority of reports (about 79.82%) were not filed online, suggesting a mix of reporting methods.
Analysis
What is the overall trend in the number of incidents reported from 2018 to the present?
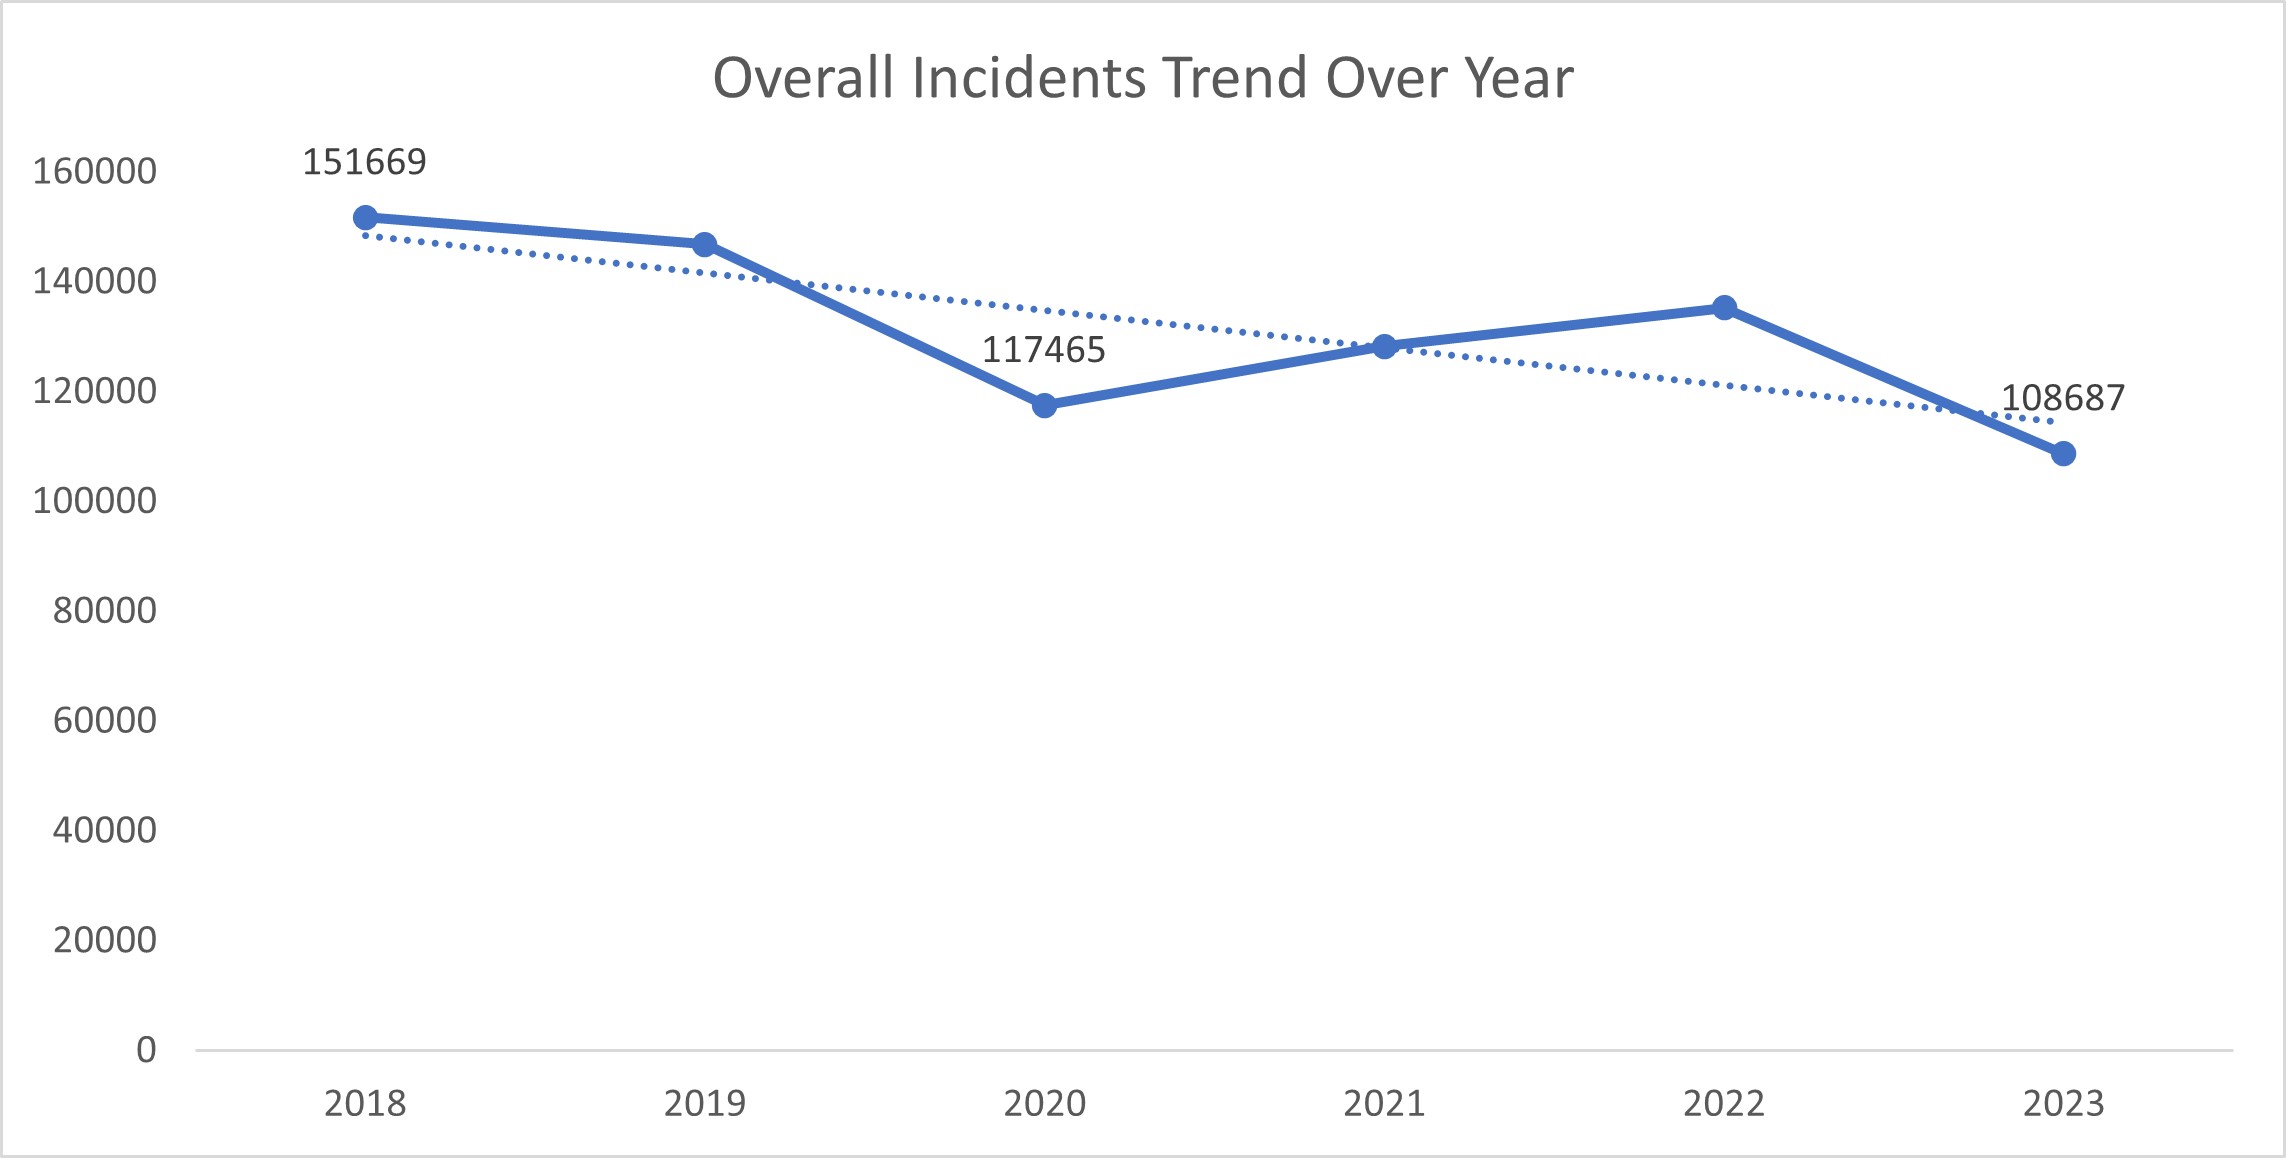
The trend in reported incidents from 2018 to October 27, 2023 exhibits a declining pattern. Notably, 2018 recorded the highest number of incidents, totaling 151,669 reports, while 2023, though not yet concluded, has shown the lowest count so far, with 108,687 incidents. It’s essential to consider that this data only covers up to October. Noteworthy is the year 2020, marked by the COVID-19 pandemic, which saw a decrease in incidents to 117,465.
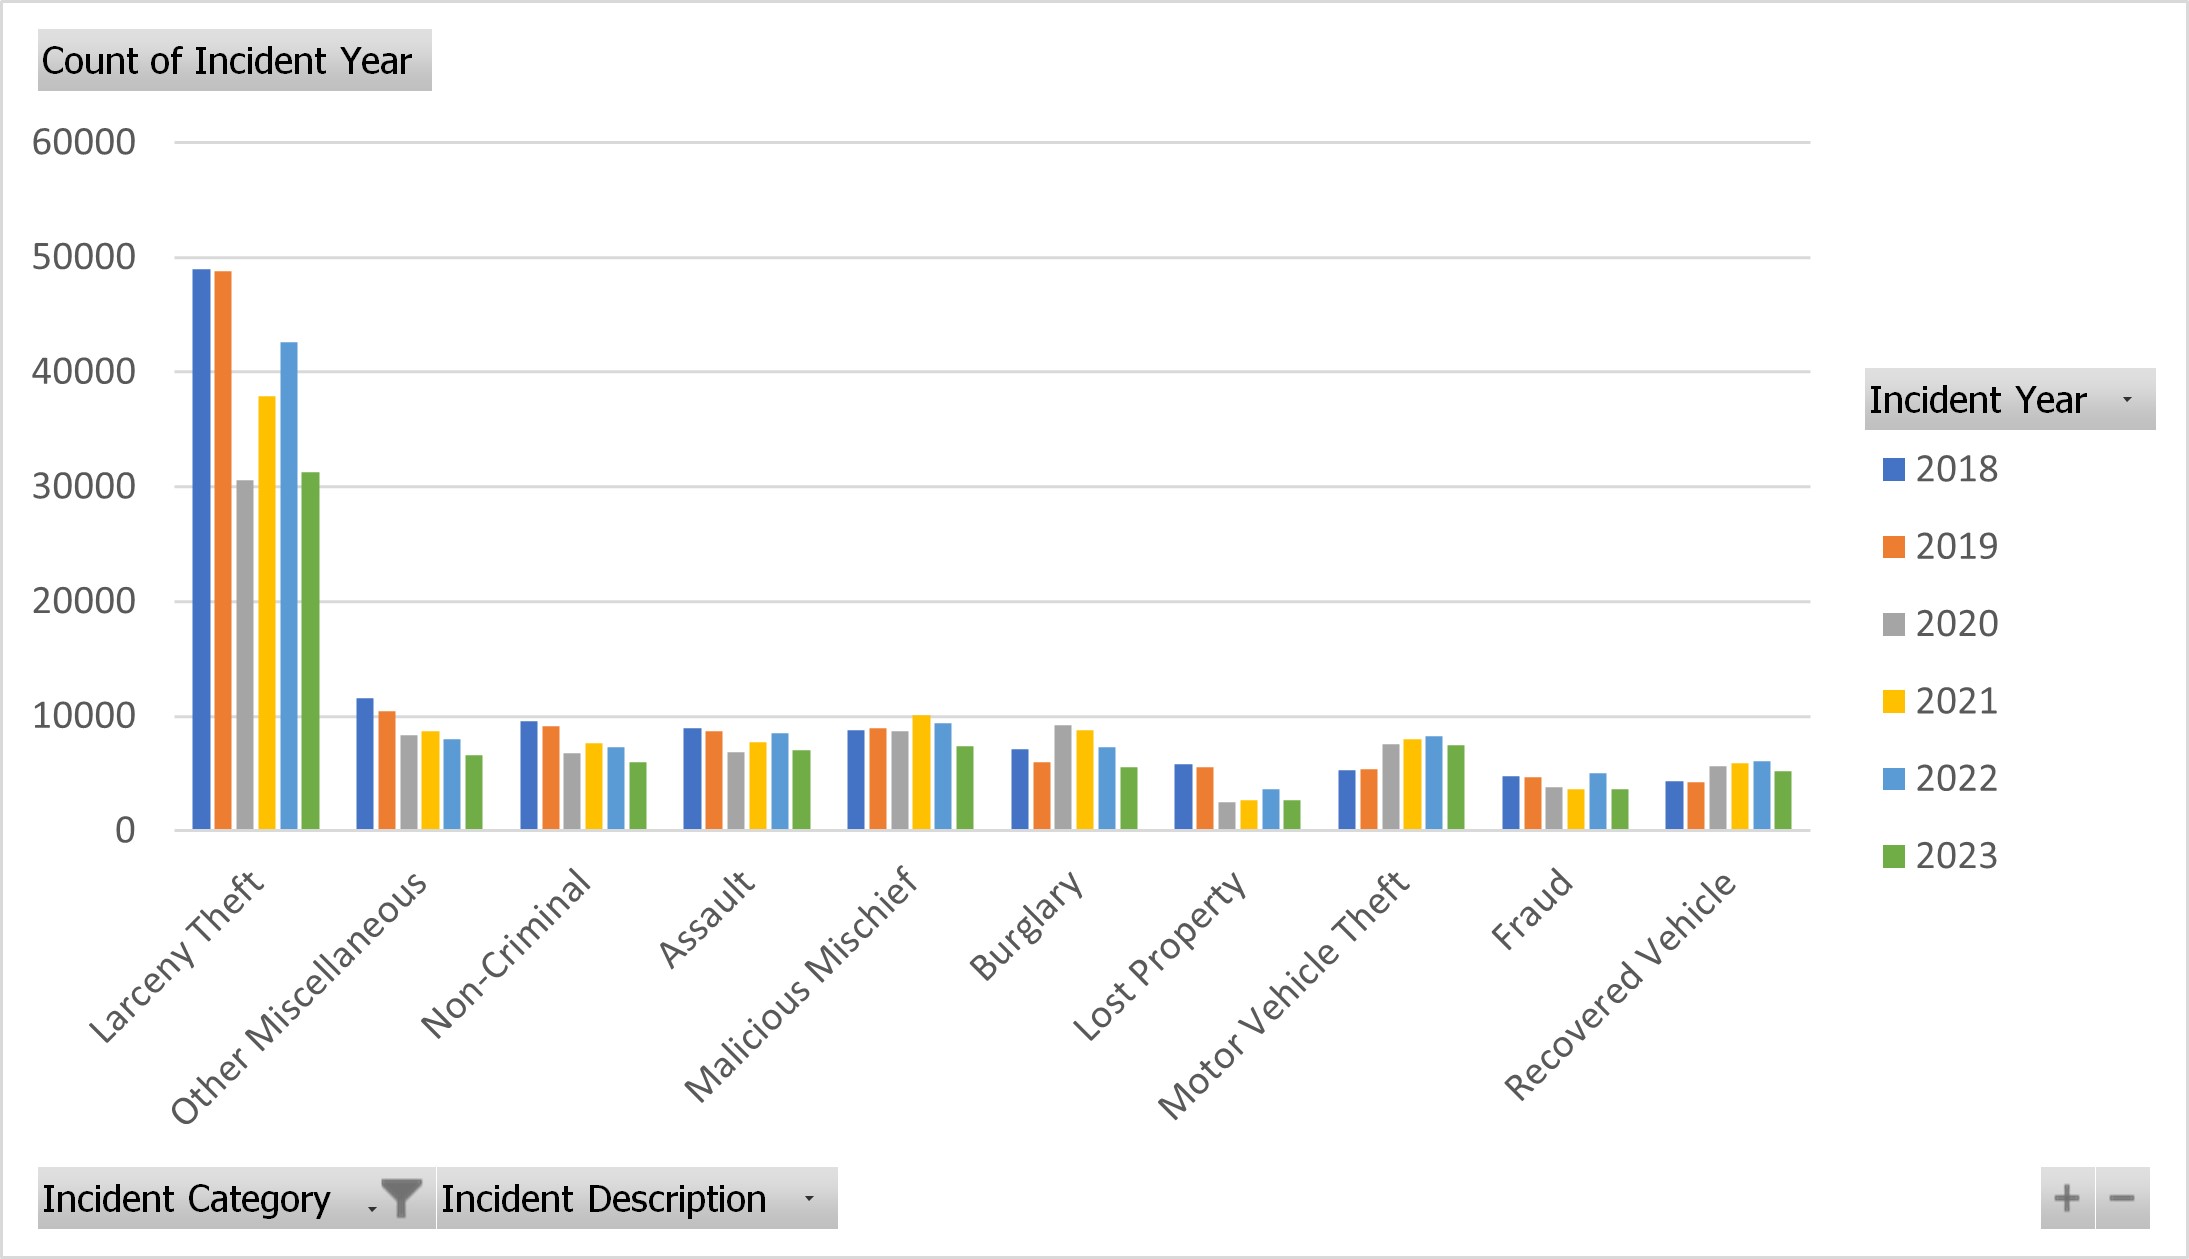
Larceny theft consistently emerges as the most prevalent incident category across all years. Notably, in 2020, a general decrease in incidents occurred, although there was an increase in Burglary cases.
| 2018 | 2019 | 2020 | 2021 | 2022 | 2023 | |
|---|---|---|---|---|---|---|
| Larceny Theft | 48975 | 48827 | 30605 | 37866 | 42647 | 31234 |
| Other Miscellaneous | 11582 | 10407 | 8346 | 8699 | 8036 | 6601 |
| Non-Criminal | 9592 | 9089 | 6809 | 7669 | 7331 | 6030 |
| Assault | 8932 | 8722 | 6901 | 7718 | 8558 | 7018 |
| Malicious Mischief | 8797 | 8946 | 8708 | 10068 | 9405 | 7379 |
| Burglary | 7090 | 6022 | 9195 | 8810 | 7276 | 5548 |
| Lost Property | 5813 | 5515 | 2535 | 2721 | 3631 | 2697 |
| Motor Vehicle Theft | 5283 | 5394 | 7561 | 7985 | 8229 | 7474 |
| Fraud | 4785 | 4711 | 3818 | 3667 | 4998 | 3626 |
| Recovered Vehicle | 4330 | 4254 | 5656 | 5907 | 6112 | 5249 |
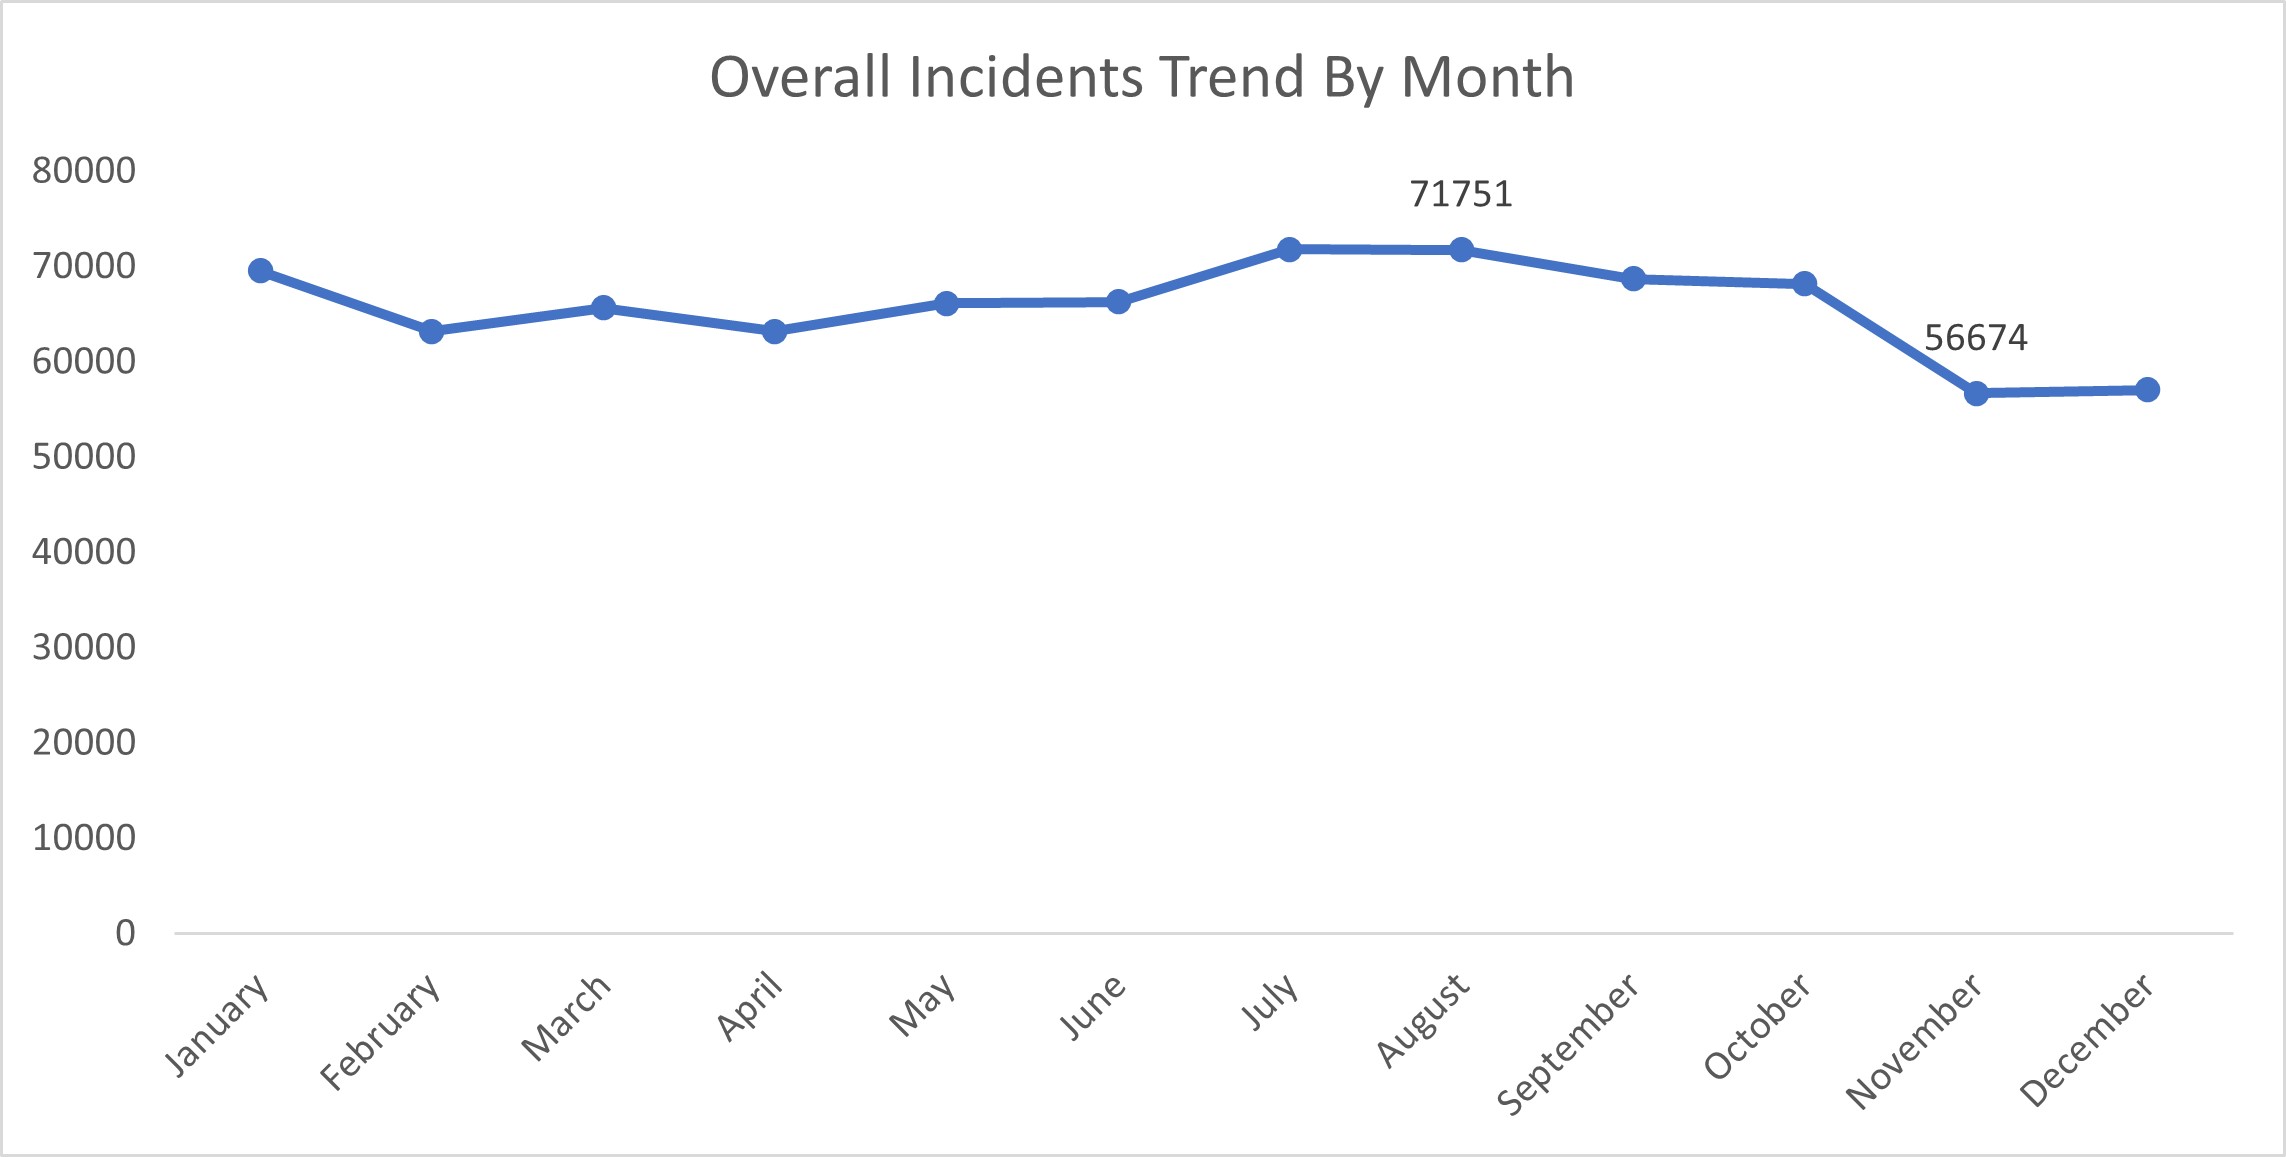
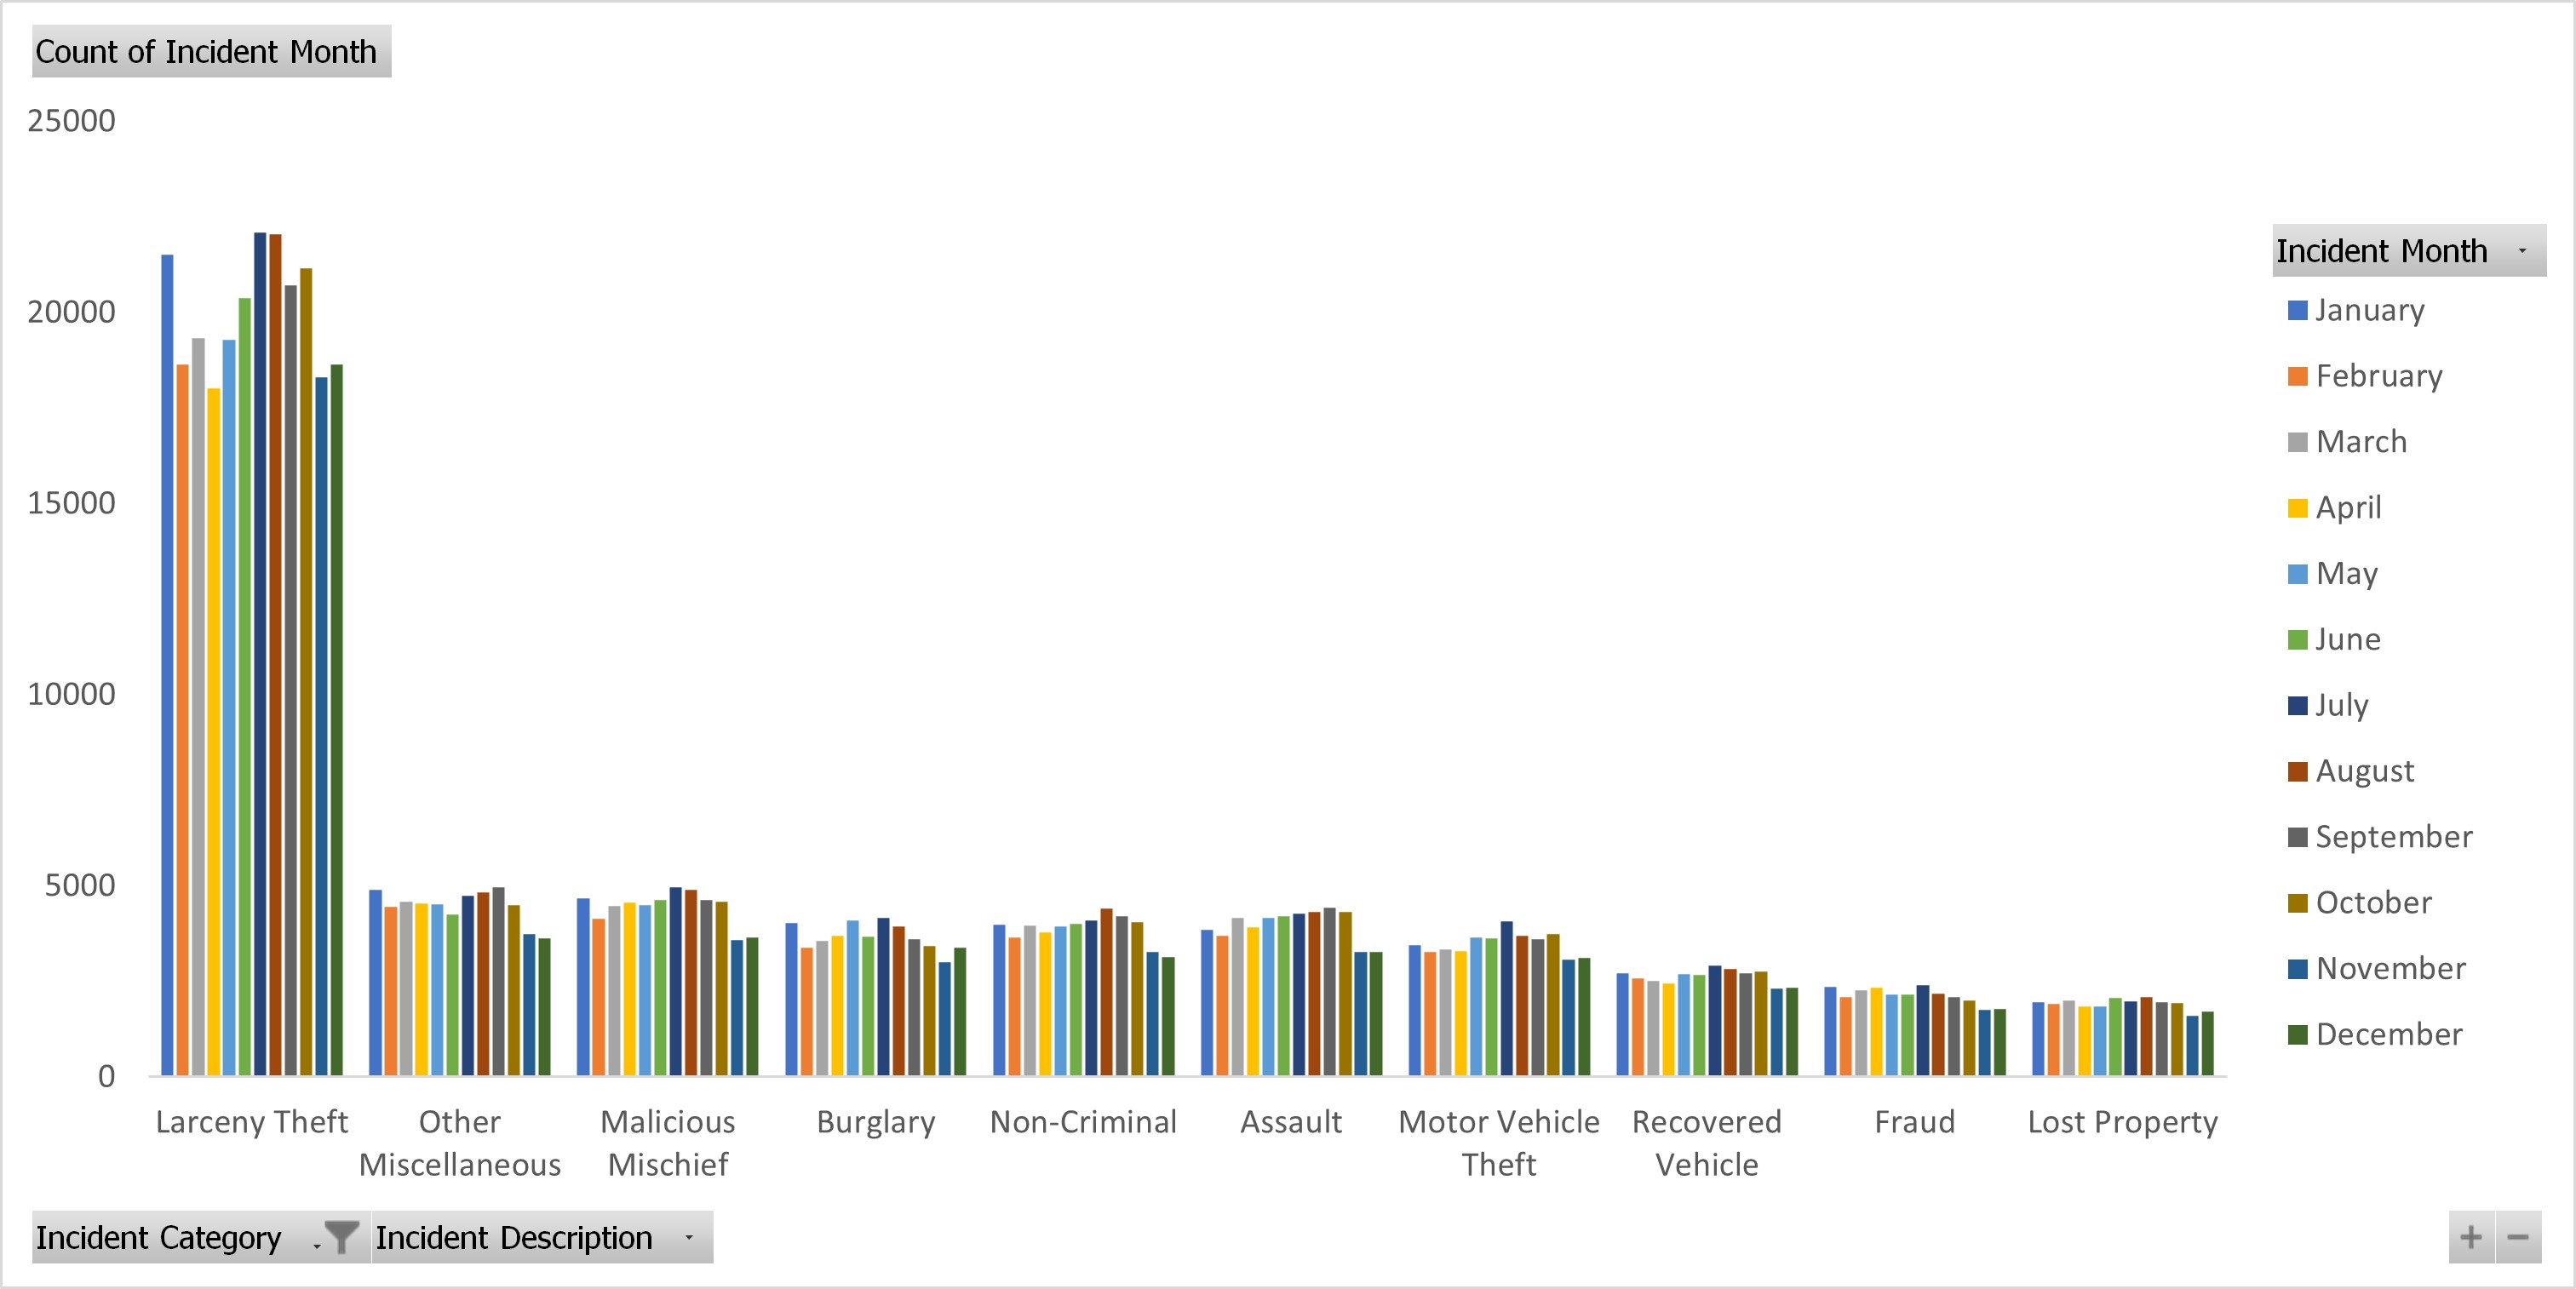
The distribution of incidents across the months appears to be fairly uniform. August records the highest incident count, totaling 71,751. Conversely, November and December exhibit the lowest counts. Notably, as there are no reports available yet for November and December 2023, it’s anticipated that these counts will align with the patterns observed in preceding months.
The distribution of incidents across the months appears to be fairly uniform. August records the highest incident count, totaling 71,751. Conversely, November and December exhibit the lowest counts. Notably, as there are no reports available yet for November and December 2023, it’s anticipated that these counts will align with the patterns observed in preceding months.
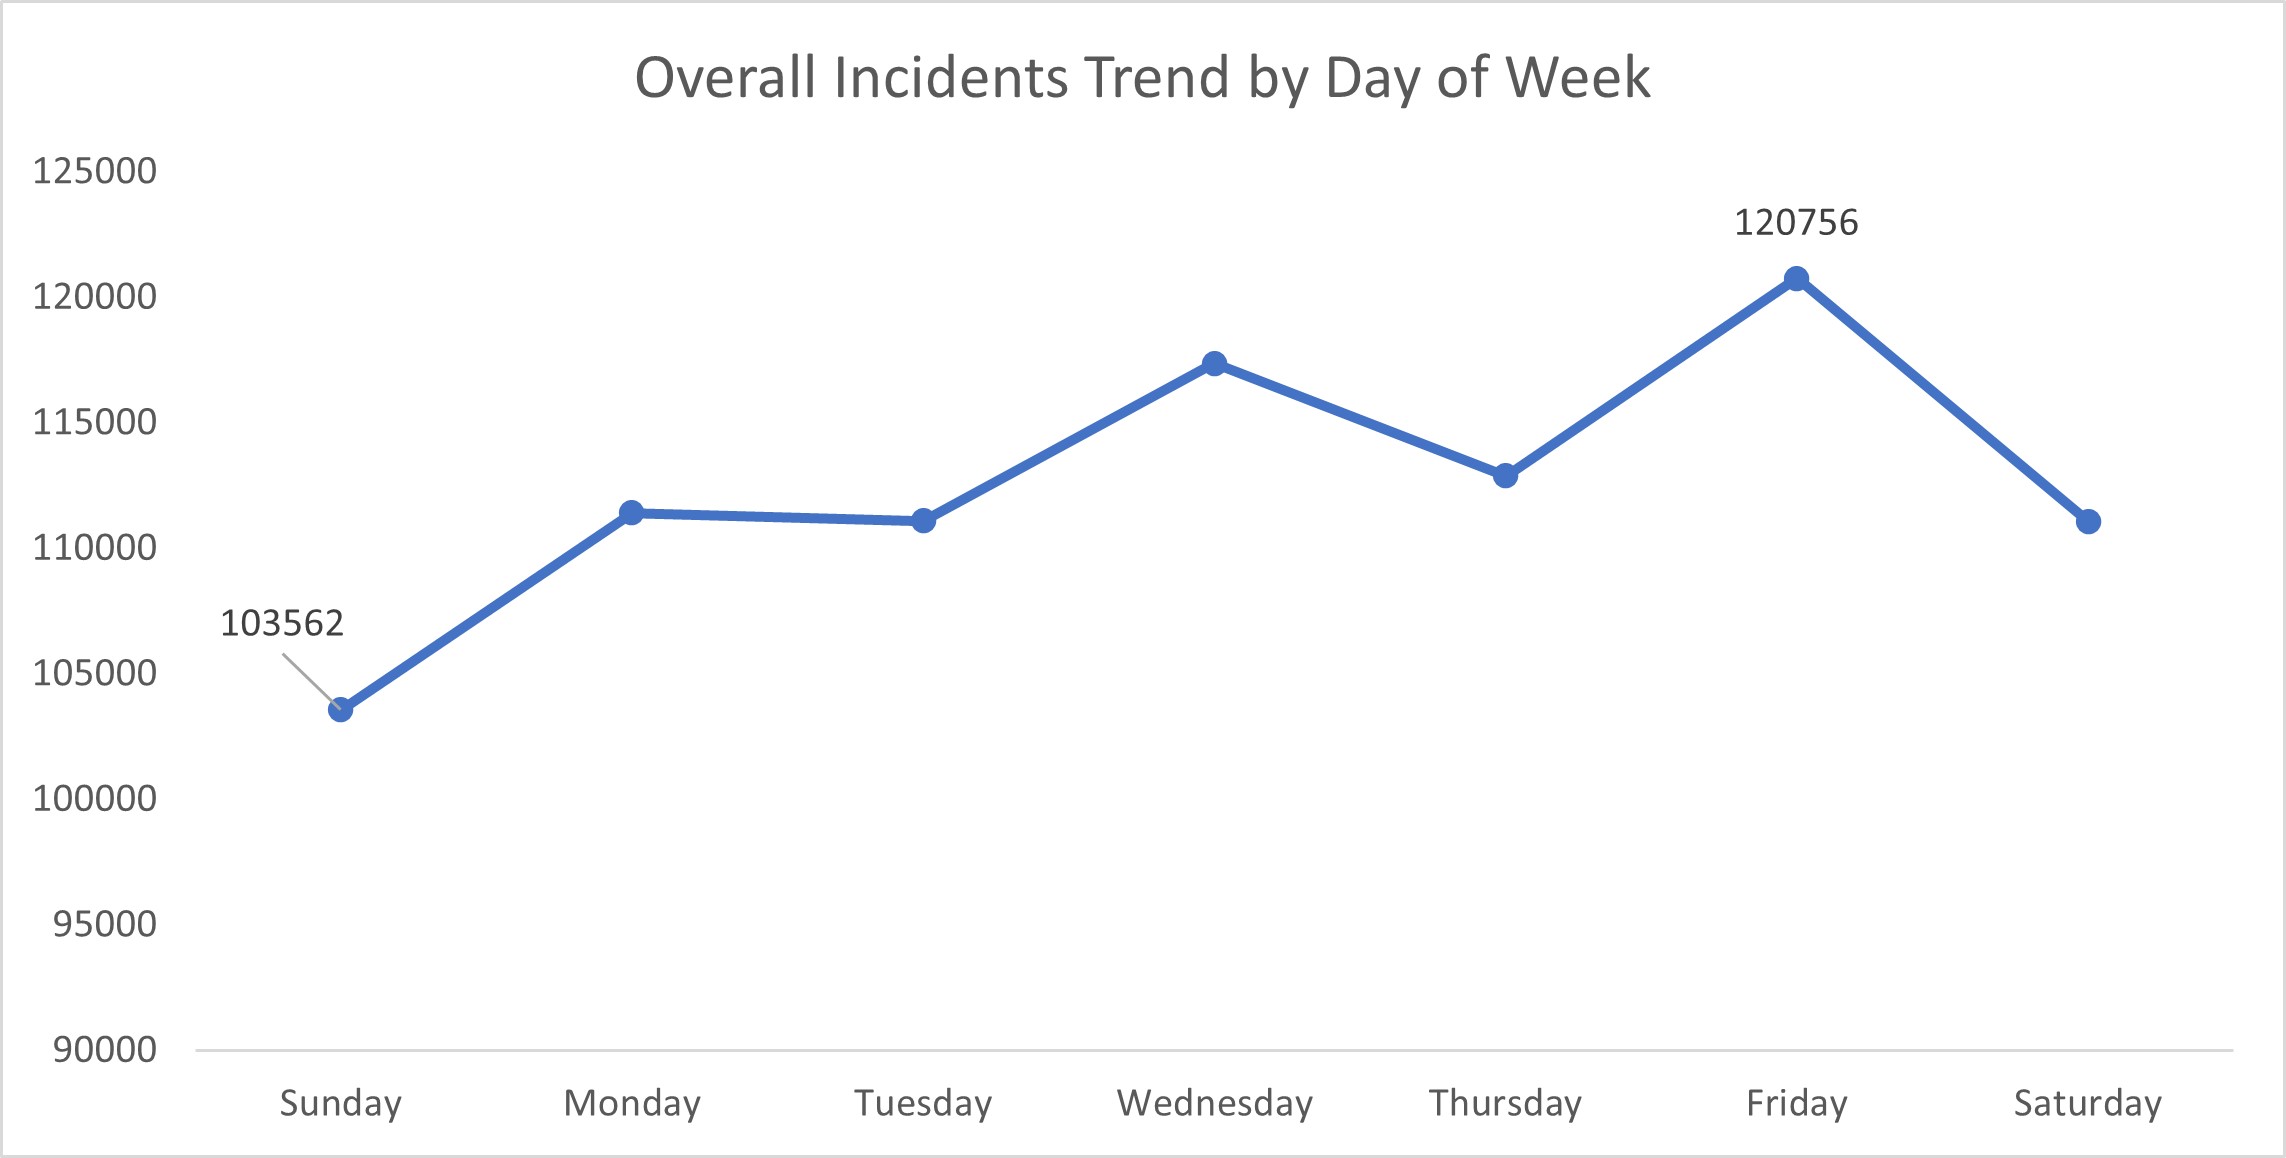
The analysis of weekly incident trends reveals a notable increase in reported incidents. Sundays exhibit the lowest incidence, totaling 103,562, while Fridays present the highest count, reaching 120,756.
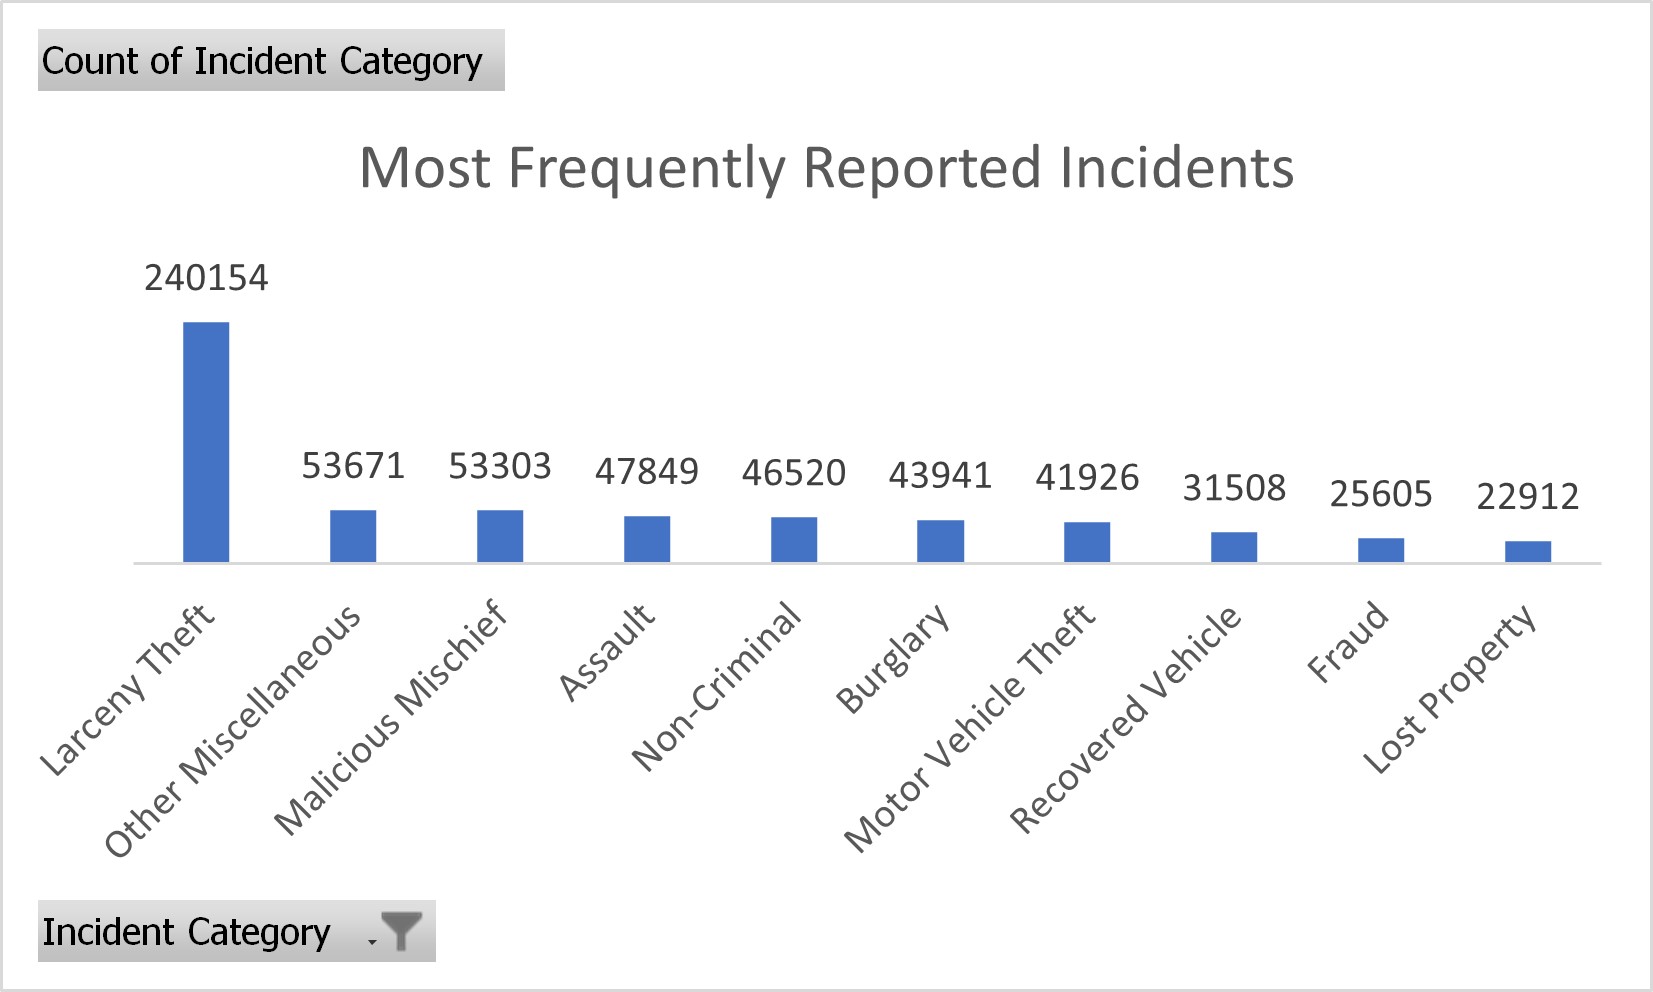
Within incident categories, “Larceny Theft” emerges as the most frequently reported category. Notably, a substantial portion of these incidents involves thefts from locked vehicles, often exceeding $950 in value. Following closely, incidents involving property vandalism represent another noteworthy trend.
Which types of incidents are most frequently reported?
- Larceny Theft: This incident type accounts for the highest percentage, representing 30.47% of all reported incidents. Larceny Theft typically involves the unlawful taking of personal property from vehicles.
- Other Miscellaneous: This category encompasses various incidents, constituting 6.81% of all reported cases. Examples include driving without a valid or suspended license, loitering, and intimidation, among others.
- Malicious Mischief: This category represents 6.76% of the reported incidents. Malicious Mischief incidents involve intentional damage or destruction of property.
- Assault: Assault incidents, encompassing both simple and aggravated assaults, make up 6.07% of the reported cases. These incidents involve threats or acts of violence against individuals.
- Non-Criminal: This category, accounting for 5.90% of reported incidents, includes situations where no criminal activity occurred.
- Burglary: Burglary incidents contribute to 5.58% of all reported cases. Burglary typically involves unlawful entry into a building or property with the intent to commit theft or a felony.
- Motor Vehicle Theft: This category represents 5.32% of the reported incidents, involving the theft of motor vehicles.
- Recovered Vehicle: This incident type accounts for 4.00% of all reported cases, indicating incidents where previously stolen vehicles have been recovered.
- Fraud: Fraud incidents, comprising 3.25% of reported cases, involve deceptive practices intended to secure unfair or unlawful gain.
- Lost Property: This category constitutes 2.91% of all reported incidents, encompassing cases where individuals have lost personal belongings.
Which neighborhoods exhibit the highest concentration of reported incidents?
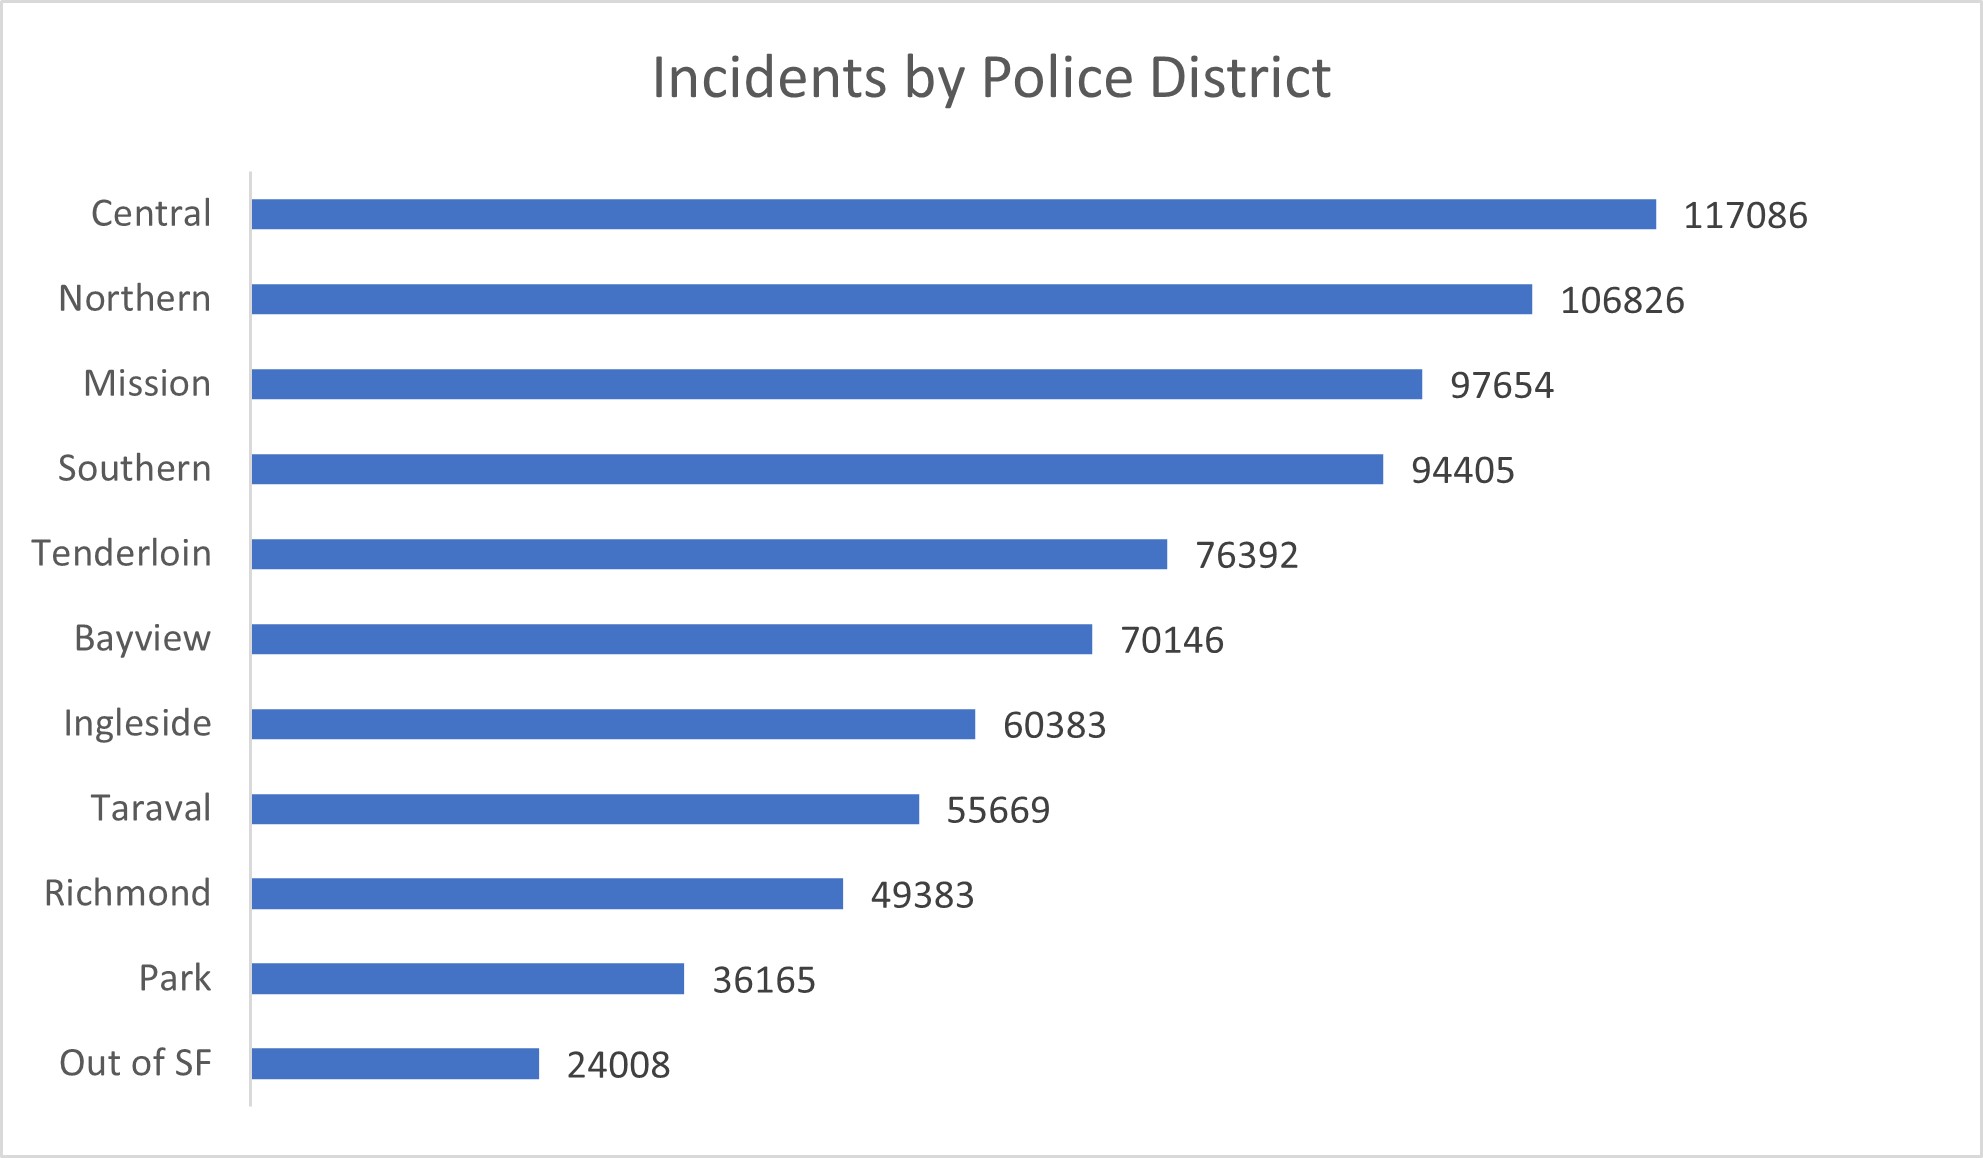
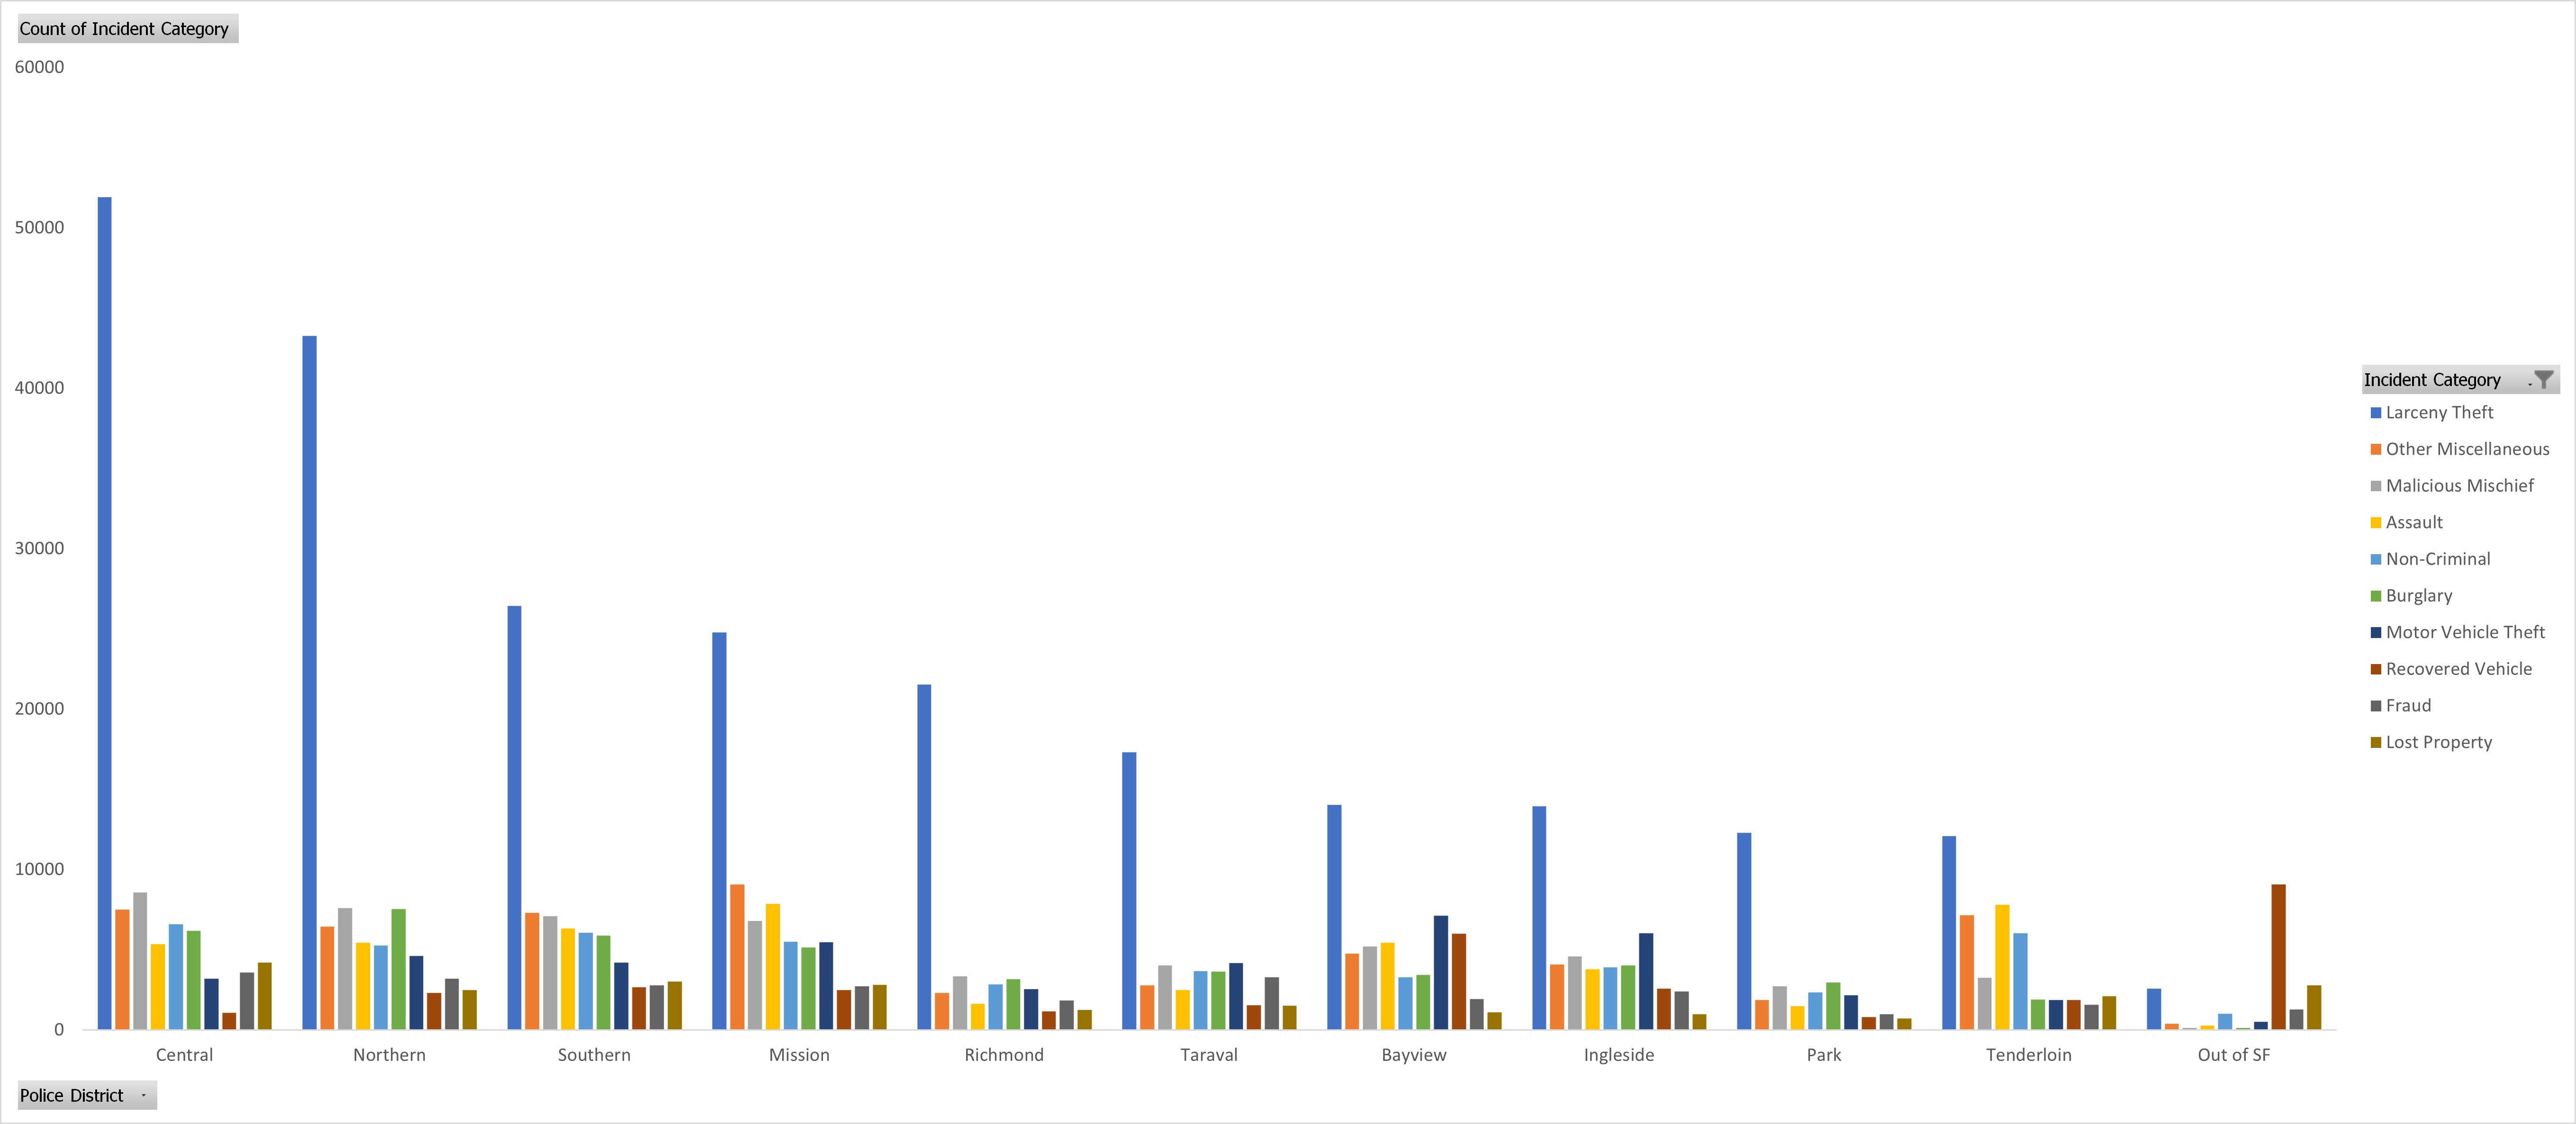
The Central area stands out as the epicenter of reported incidents, accounting for 14.86% of the total. This area exhibits elevated counts in multiple categories, particularly Larceny Theft and Other Miscellaneous incidents. In contrast, the Park area demonstrates a comparatively lower incidence rate, suggesting a potentially safer environment. Notably, the “Out of SF” category encompasses incidents occurring beyond San Francisco’s jurisdiction, registering significantly fewer reported cases than other areas. It’s noteworthy that incidents in the “Recovered Vehicle” category are documented in the Out of San Francisco area.
What time of day sees the highest incidence of reported incidents?
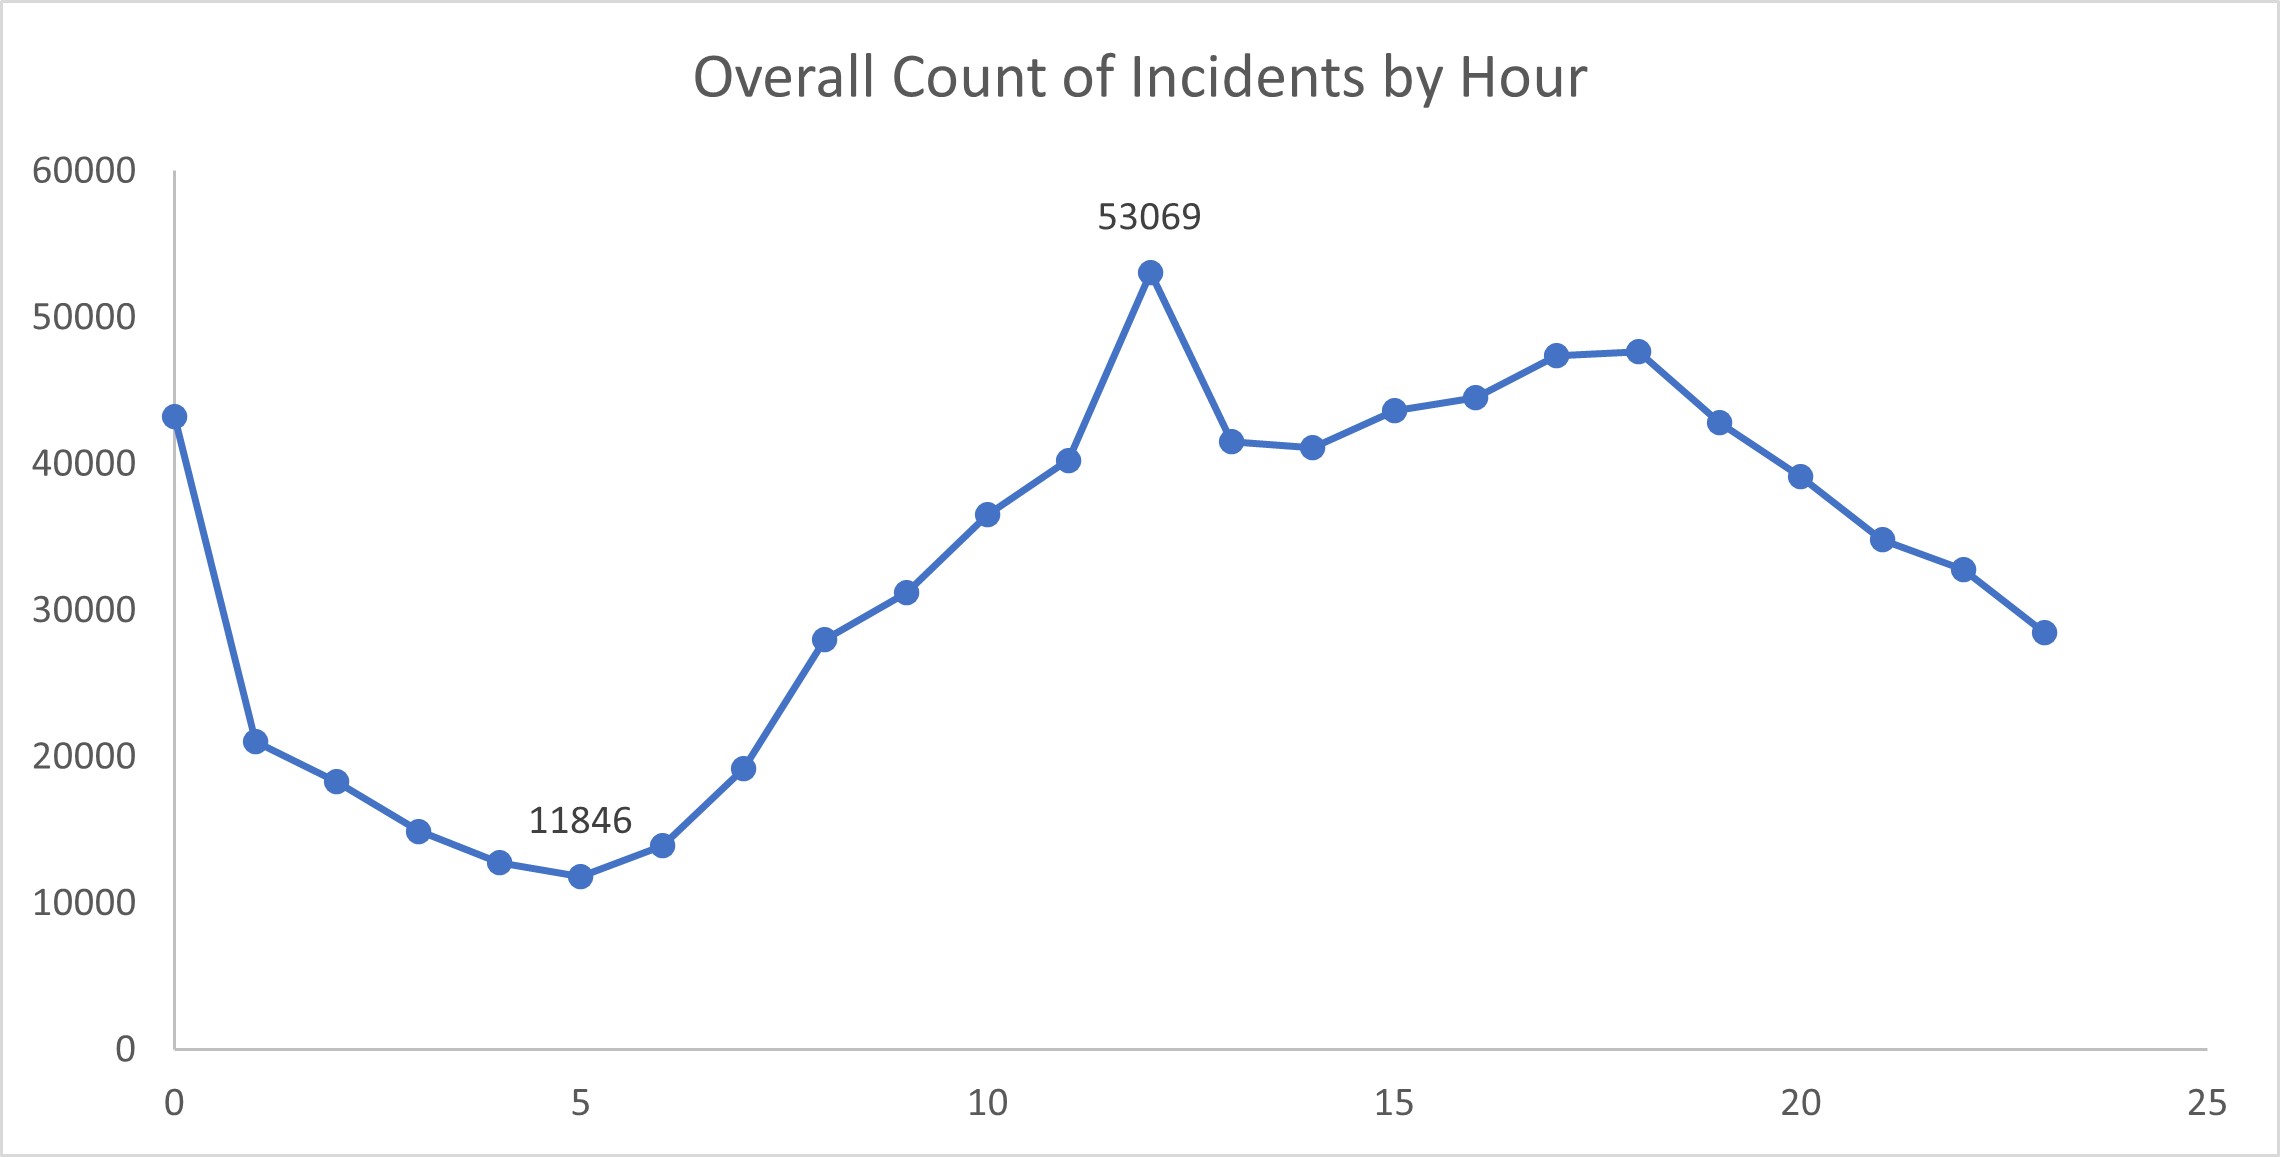
Looking at incidents throughout the day, we see a clear trend. Incidents start off low at 5 AM with 11,846 reported cases. They steadily rise and peak at noon with 53,069 incidents. After that, they start to decrease again.
While the Central district reports the most incidents overall, the Northern area has the highest incidents of larceny theft before 9 AM. After 9 AM, incidents start to increase, mostly in the Central area, and then they taper off after 9 PM, repeating this pattern.
Are there incidents involving the same individuals or locations occurring over time?
| Count Incidents | Frequency |
|---|---|
| 226 | 1 |
| 47 | 1 |
| 34 | 1 |
| 28 | 1 |
| 26 | 1 |
| 21 | 3 |
| 20 | 2 |
| 19 | 1 |
| 18 | 4 |
| 17 | 5 |
| 16 | 6 |
| 15 | 13 |
| 14 | 16 |
| 13 | 24 |
| 12 | 36 |
| 11 | 52 |
| 10 | 100 |
| 9 | 229 |
| 8 | 295 |
| 7 | 575 |
| 6 | 2155 |
| 5 | 2358 |
| 4 | 6412 |
| 3 | 30095 |
| 2 | 108381 |
| 1 | 418770 |
In the provided frequency table, it’s observed that a significant portion of incidents are unique, representing 73.53% of all records (or 418,770 incidents). These unique incidents cover various categories, with a notable concentration in the larceny theft category, as previously mentioned.
On the other hand, the remaining 26.47% of incidents involve multiple occurrences of the same incident, which may likely pertain to the same individual. Notably, one case stands out with an extraordinary frequency of 226. This particular incident, labeled as 190202001, encompasses both larceny theft and lost property, with an open or active resolution status. Its timeline spans from February 2, 2018, up to the most recent report filed on March 19, 2021.
Furthermore, it’s worth highlighting that this incident is predominantly associated with the Northern, Mission, and Park areas. Given the sheer volume of incidents, it’s conceivable that multiple individuals are involved in these occurrences.
Do specific events or holidays correlate with spikes in reported incidents?
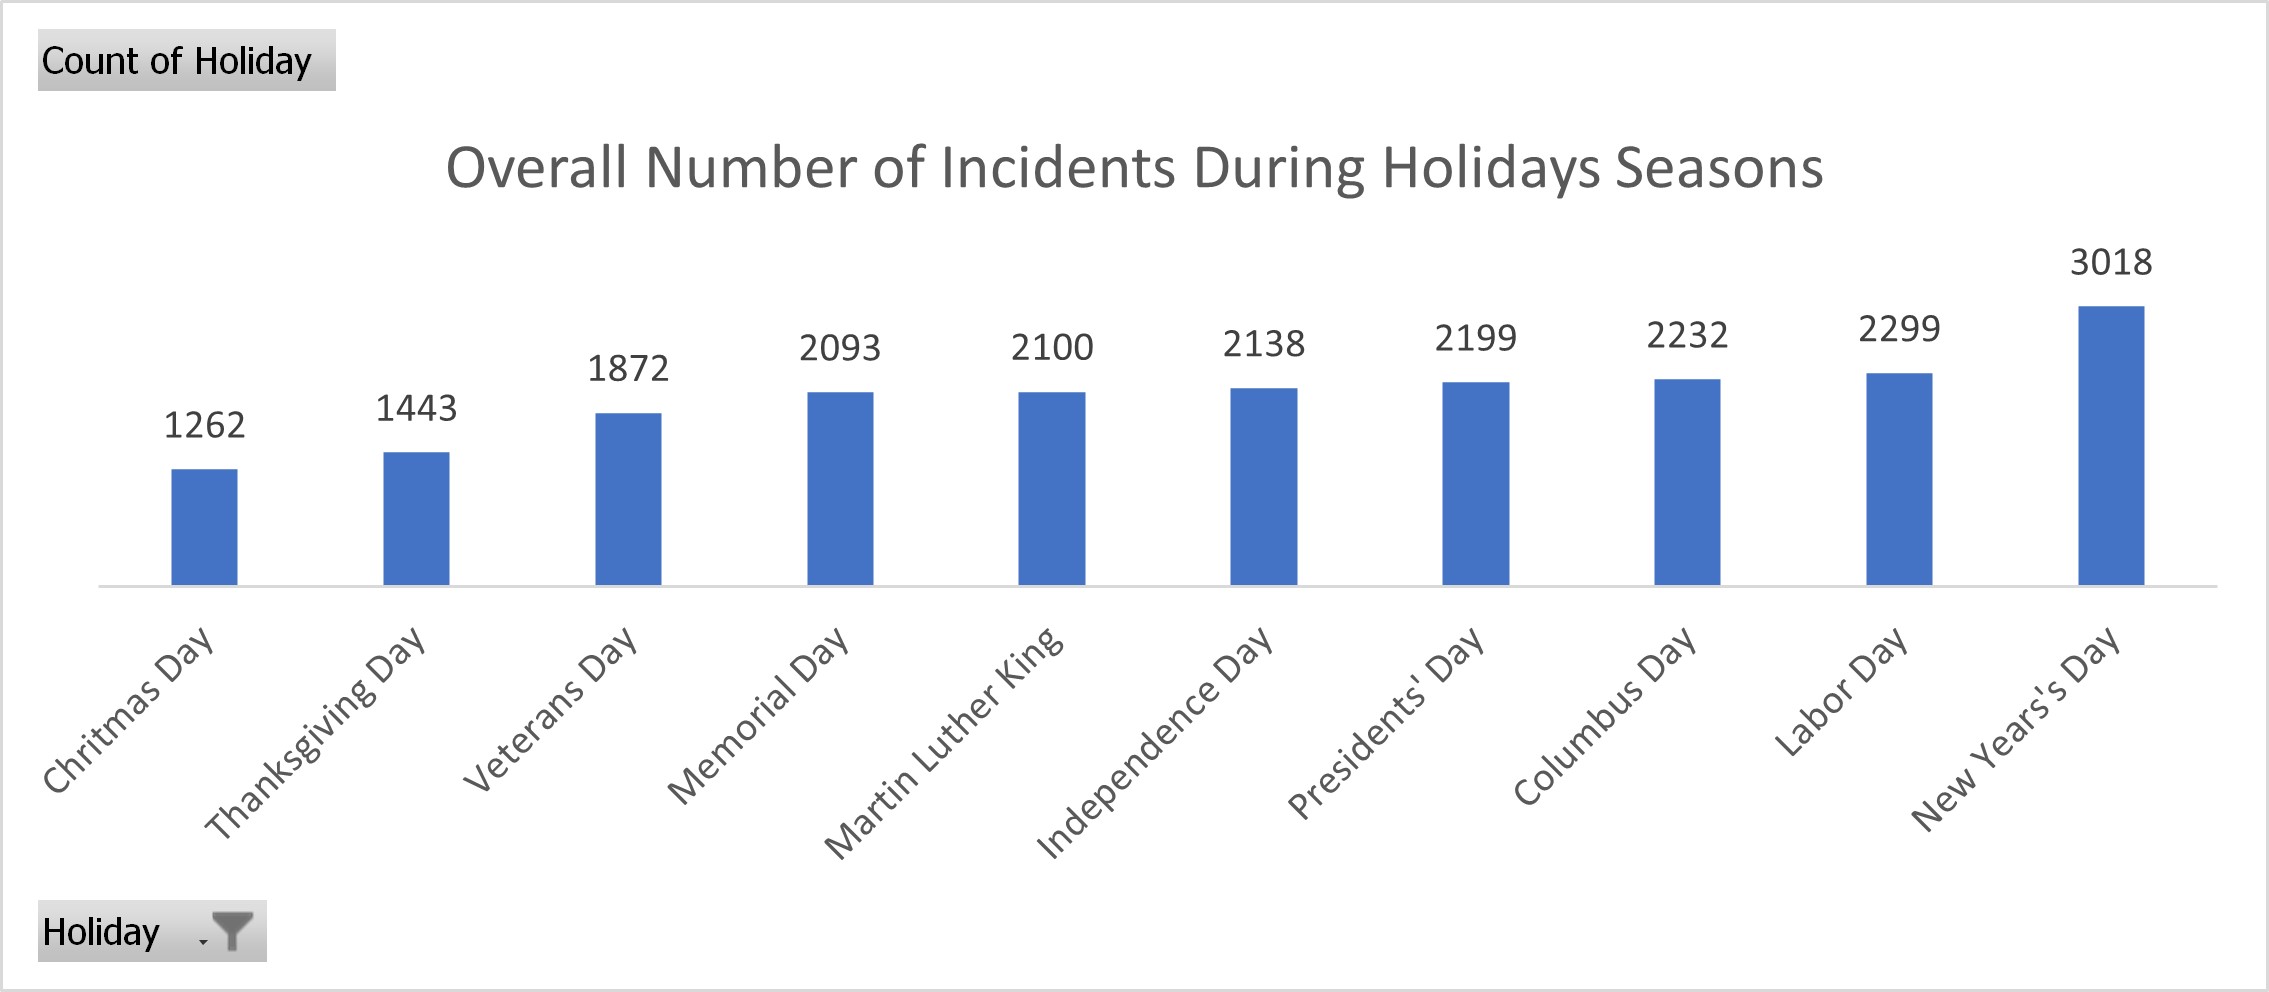
The data indicates that incidents reported on holidays account for approximately 2.62% of all reported incidents. The majority of these incidents fall within the category of larceny theft. This suggests that holidays may not significantly influence an increase in reported incidents. Below is the count of incidents reported on specific holidays:
- Christmas Day: 1,262 incidents
- Thanksgiving Day: 1,443 incidents
- Veterans Day: 1,872 incidents
- Memorial Day: 2,093 incidents
- Martin Luther King: 2,100 incidents
- Independence Day: 2,138 incidents
- Presidents’ Day: 2,199 incidents
- Columbus Day: 2,232 incidents
- Labor Day: 2,299 incidents
- New Year’s Day: 3,018 incidents
It’s worth noting that these numbers represent the count of incidents on each holiday and provide insight into the overall trends related to holidays and incident reporting.
Closing Thoughts
In examining the San Francisco Police Department dataset spanning from 2018 to October 2023, several significant observations have come to light.
The data reflects a declining trend in reported incidents over the years, with 2018 registering the highest number of cases. This trend, though subject to change, is a pivotal finding.
Larceny Theft emerges as the most prevalent incident type, closely followed by categories like Other Miscellaneous, Malicious Mischief, and Assault. Understanding these common incident types is crucial for focused law enforcement efforts.
Geographically, the Central area stands out with the highest incidence of reported incidents, making up nearly 15% of all cases. Furthermore, the Northern area experiences a surge in larceny theft incidents in the early morning hours.
Recommendations:
In light of these insights, several recommendations are proposed:
- Enhanced Focus on Central Area: Given the concentration of incidents in the Central area, law enforcement agencies may consider allocating additional resources or implementing targeted strategies to address specific issues in this region.
- Early Morning Vigilance: The Northern area experiences a spike in larceny theft incidents in the early morning hours. Increased vigilance during this time may help deter such incidents.
- Utilizing Temporal Insights: The temporal analysis reveals distinct patterns in incident reporting. Law enforcement agencies can optimize resource deployment based on these trends to ensure a more effective response.
- Continuous Monitoring: Regularly monitoring incident data and conducting periodic analyses can provide ongoing insights for law enforcement agencies. This proactive approach can help identify emerging trends and address them promptly.


